anatplot
anatplot is a Python package for plotting data on brain surfaces and visualizing anatomical regions in 3D. You can optionally add electrode contacts to any plot, then save a Matplotlib figure or explore and export the 3D scene.
Choose a plot
| What you want to show | Use | Tutorial |
|---|---|---|
| A cortical map or parcel labels on brain surfaces | SurfacePlot |
Surface basics |
| Selected regions from a labelled anatomical image | ROIPlot |
ROI tutorial |
| A translucent whole-brain view that reveals contacts inside the brain | VolumePlot |
Volume tutorial |
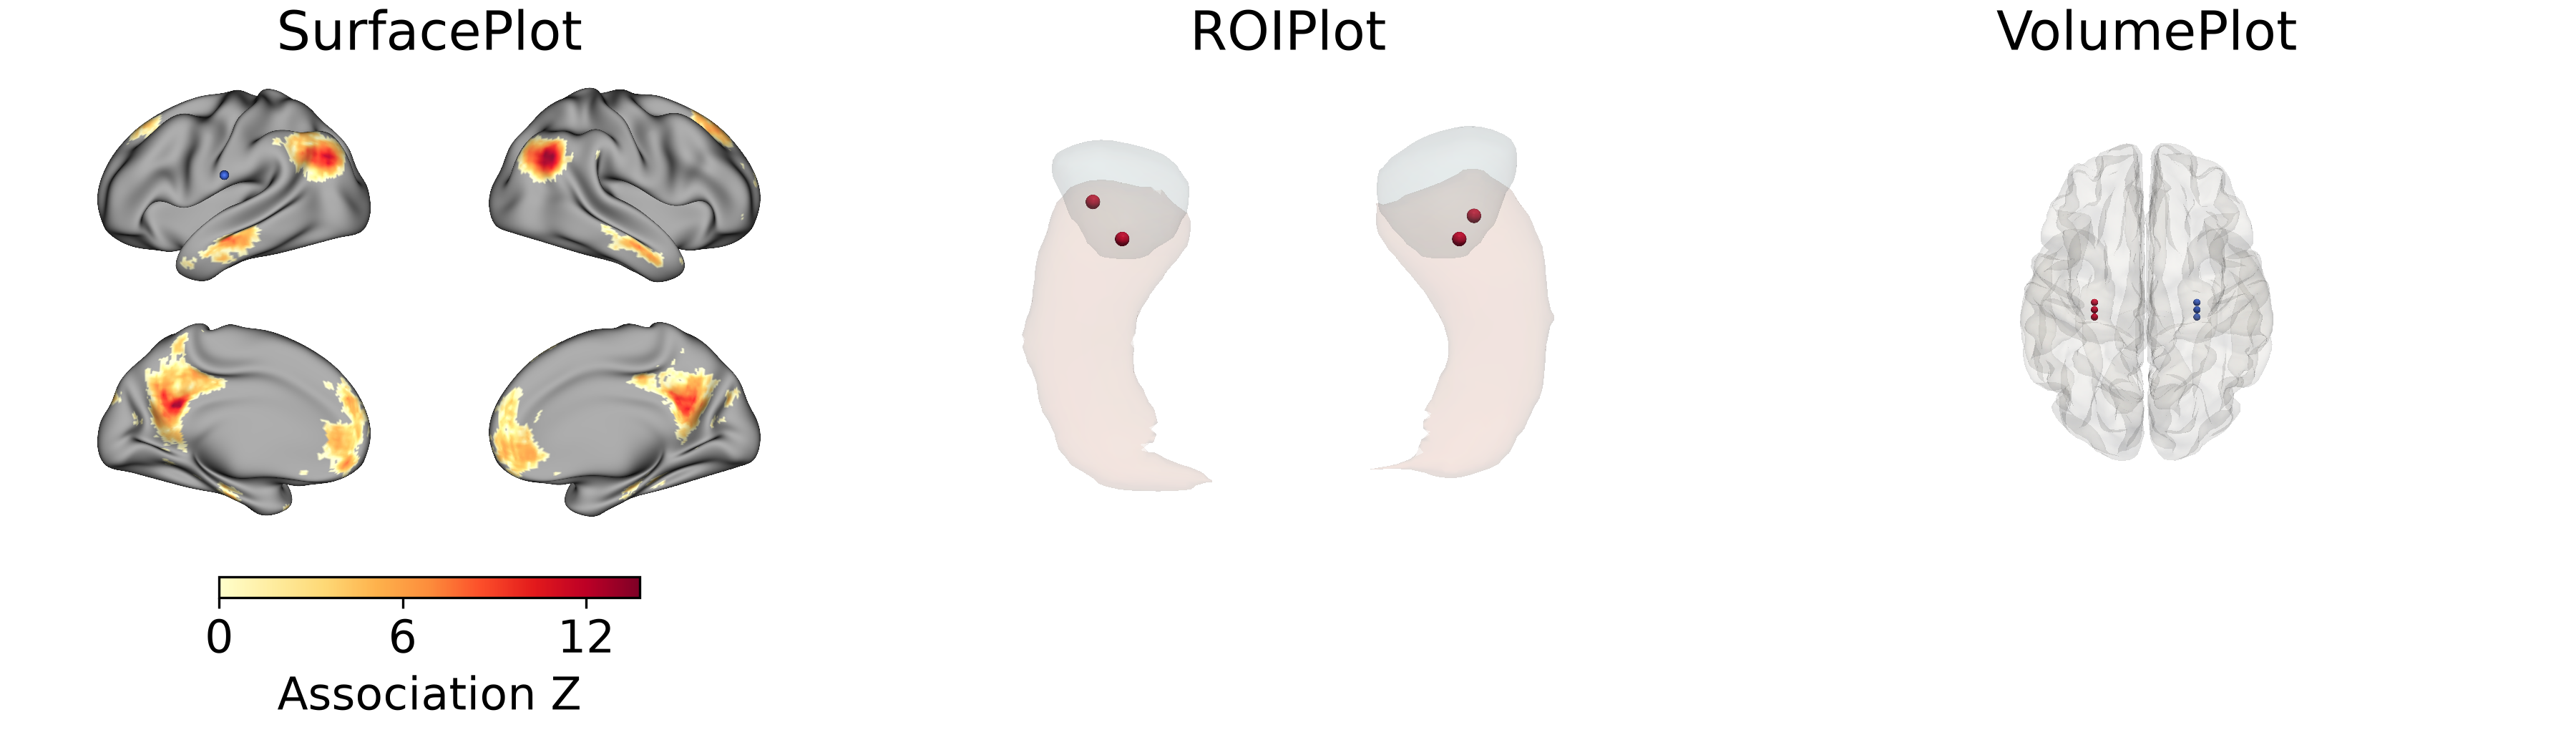
SurfacePlot has the most complete workflow, though its API may still evolve.
ROIPlot and VolumePlot are under development.
Install
Install the current development release from PyPI with Python 3.10 or newer:
uv add "anatplot==0.1.0.dev0"
python -m pip install "anatplot==0.1.0.dev0"
Make your first figure
Draw a Neurosynth default-mode association map and a contact on inflated cortical surfaces.
import numpy as np

from anatplot import SurfacePlot, datasets

surfaces = datasets.fetch_surfaces("fsLR", surface="inflated", density="32k")
left, right = datasets.fetch_dmn_map_fslr32k()
association = {
    "left": np.ma.masked_equal(left, 0),
    "right": np.ma.masked_equal(right, 0),
}

# The with block automatically closes the scene and releases graphics resources.
with SurfacePlot(
    **surfaces,
    views=["lateral", "medial"],
    # Show left/right hemispheres side by side, with outer views above inner views.
    layout="grid",
    window_size=(1000, 600),
    zoom=1.5,
) as plot:
    plot.add_layer(association, cmap="YlOrRd", cbar=True, cbar_label="Association Z")
    plot.add_contacts([[-64, -13, 23]], radius=4, color="royalblue")
    fig = plot.to_figure(figsize=(10, 7))

fig.savefig("surface-map.png", dpi=300)

Acknowledgements
- Design inspiration: The design of
SurfacePlot, especially its plotting workflow and default appearance, was strongly inspired by surfplot. - Rendering and figures: anatplot renders brain scenes with PyVista / VTK and composes figures with Matplotlib.
- Public data: neuromaps, TemplateFlow, Nilearn, and NetNeuroLab.